Here are key pros and cons for evaluating root cause analysis processes. This page looks at four common root cause analysis approaches.
Evaluating Root Cause Analysis Processes
Are you evaluating root cause analysis processes? If so, this page looks at the pros and cons of five common root cause analysis approaches.
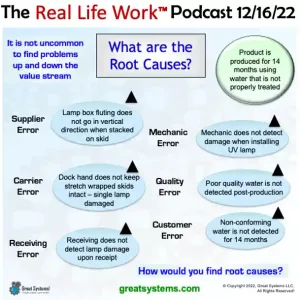
Organizations use a variety of approaches to find the root causes of problems. In turn, evaluating which root cause analysis process to use is important. The most popular, formal approach is probably the fishbone, or Ishikawa, diagram. This approach has been in use for at least 50 years. It includes use of the ‘5 Why’ process to build out possible causes on each bone.
The ‘5 Why’ technique came more into vogue with the growth in popularity of lean manufacturing and six sigma methodologies. This tool has been in use since 1980, if not before. To note, it is part of the Toyota Production System model. Unfortunately, few organizations truly master the skills one needs to (1) find the root causes of their problems and (2) implement fundamental system changes to address those causes. In turn, they continue to face the same issues day in and day out. Their problems continue over time.
LEARN MORE: Buy my new ‘How to Lead Great Investigations’ book on amazon.com!
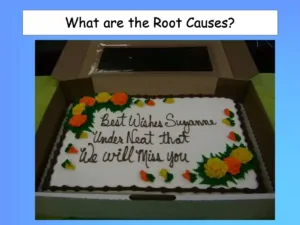
What are the Most Common Root Cause Analysis Processes?
This page looks at the similarities and differences between five common techniques organizations use for root cause analysis – the 5 Whys, Kepner-Tregoe Problem Analysis, fishbone or Ishikawa diagrams, change analysis, fault tree analysis – and the TapRooT® root cause analysis process.
For help in evaluating root cause analysis processes, I discuss these techniques below. Then, I present a summary of the eight advantages the TapRooT® root cause analysis process provides. You get to decide which approach might work the best for you.
LISTEN to my ‘Root Cause Analysis FAQs’ Real Life Work podcast episode!
Evaluating Root Cause Analysis Options: 5 Whys
5 Why Features:
From my perspective, the Five Whys represent more of a conceptual, versus a systematic, fact-driven approach, to root cause analysis. It was adopted from the Japanese approach to management, and most notably practiced by Mr. Shigeo Shingo. Shingo would use the five whys on the production floor when he would tour manufacturing sites. In essence, Mr. Shingo would continue to ask why five or more times to get to the true cause of a problem. His questions were structured to help lead the employees he was talking to towards the problem’s source.
5 Why Advantages:
If a person knows how to ask good, successive ‘why’ questions, and is able to ask them of the right people, he or she will find at least one root cause for a given problem. This approach takes little time to perform. One needs as few as five minutes to perform a ‘5 Why’ analysis. It does not require the use of special software, flip chart paper, or reading materials. Performing the process repeatedly with the same group of people in a sound manner can lead to a new way of thinking amongst those people that have been exposed to the tool’s use.
5 Why Disadvantages:
The 5 Why approach normally leads to the identification of just one root cause for the problem in question. You will need to go through the ‘5 Why’ process several times for a given problem in order to identify all root causes. To do so effectively requires even more skill of the part of the question asker. It also does not necessarily point the problem solver towards the generic causes of similar problems.
This approach requires significant skill in order to learn how to ask the right why questions. The ‘5 Why’ technique is not as simple as asking ‘why?’ five times. The use of this tool will lead to the definition of a root cause that is also a necessary change (a corrective action). The 5 Why process does not often result in a sound set of corrective actions. Most people fail to gain much success when they use this tool. This is often because they cannot develop the ability to ask good, successive ‘why’ questions. Mr. Shingo could do so with skill, but few others can.
Evaluating Root Cause Analysis Options: Kepner-Tregoe Problem Analysis
Problem Analysis Features:
I attended a five-day KT training course in 1990. The training did cover root cause analysis in a sense, but more in the form of general problem analysis. The key components of the KT process include problem analysis, potential problem analysis, situation analysis, and decision analysis.
Problem analysis contains a form of root cause analysis, but is based largely on the ‘is / is not’ problem solving tool. This tool is more similar to the TapRooT® Change Analysis process.
The Decision Analysis tool is a great tool, and I still advocate its use today. It helps people evaluate possible improvement options in a systematic, fact-based manner more than find root causes.
Use Situation Analysis to assess the risk associated with possible improvements. The Potential Problem Analysis tools helps you look at the possible repercussions of failing to make a change.
Problem Analysis Advantages:
Like TapRooT®, if the user performs a good problem investigation and collects a lot of information (especially data), they can find the causes of the specific problem. These problems might not be specifically called root causes. To me, the Decision Analysis tool is one of the best out there for evaluating improvement options (possible corrective actions).
Problem Analysis Disadvantages:
Good information and a formal evaluation process helps prevent users of any of these tools from placing too much blame on people. Tool use can consume lots of time, however. Plus, they may not be as functional as TapRooT® is in terms of getting to generic causes.
Also, I question whether or not these tools help you get to the true system problems that cause given incidents to occur. This is key feature of the TapRooT® process design. Well-rounded corrective action development is really not a focus of these tools as I remember them.
LISTEN TO my podcast on frequently asked root cause analysis questions!
Evaluating Root Cause Analysis Options: Fault Tree Analysis
Fault Tree Features:
My perspective of fault trees is that they encourage the user to (1) ask the five whys multiple times for a given type of problem and (2) evaluate several possible problem causes on one diagram. This is similar to the manpower, methods, materials, and machines boxes on a fishbone diagram. Like the other common root cause analysis approaches, fault trees are more of an opinion-based tool. Failure mode type and probabilities help you create the tree branches, but no predetermined questions exist.
Fault Tree Analysis Advantages:
From my perspective, I prefer fault trees over fishbone diagrams. Their design allows the user to identify four to five levels of ‘why’ for a given problem, if the users exercise a high level of discipline as they draw their charts. I use fault trees to to troubleshoot persistent problems, such as quality defects. Problems that won’t go away tend to have a common set of causes and sub-causes. A fault tree is similar to the TapRooT® Equifactor tree that one uses to troubleshoot equipment issues.
Fault Tree Disadvantages:
Fault trees typically fail for one of three reasons. First, people do not use them in a disciplined manner to develop multiple problem causes at each level. Second, one must sort through multiple levels of potential causes for each problem type. Third, fault tree results can be opinion driven. They often tend to be a blend of a cause effect diagram and a flow chart. In such cases, the user can easily get lost and not arrive at any particular root cause.
Also, a well-developed fault tree often leads the user to discover that the same management systems (such as poor training, employee turnover, weak communications, and poor procedure design) are at the root of their problems. This is similar to TapRooT® generic causes. A well-designed fault tree may lead you to the TapRooT® basic cause categories. However, its use rarely leads to a comprehensive mix of TapRooT® root causes.
LEARN MORE: Does Your Team Structure Drive Operational Excellence?
Evaluating Root Cause Analysis Options: Change Analysis
Change Analysis Features:
I have not seen change analysis called out as a tool for finding root causes by itself. The KT ‘is/ is not’ problem solving tool is the closest thing to change analysis that I have seen. As I stated above, this KT tool is in essence the same as the TapRooT® Change Analysis tool.
Change Analysis Advantages:
It is always useful to compare what should have happened to what did happen when analyzing a problem. This effort alone however will rarely lead you the root causes of, and corrective actions for, preventing the problem in the future.
Change Analysis Disadvantages:
The Change Analysis tool compares what should have happened to what did happen. Comparisons are made across the ‘who, what, when, where, and how’ question dimension to collect information. In turn, use of this tool may not lead you to the actual root causes and corrective actions to prevent problem return.
LEARN MORE: Process Improvement Strategies
Evaluating Root Cause Analysis Options: Fishbone or Ishikawa Diagram
Fishbone Features:
This tool is perhaps the oldest, and most well known, root cause analysis tool. In its most common form of use, the user attempts to define multiple possible causes for a given problem. Possible causes could come from four different areas – manpower, methods, materials, and machines. Teams often use the ‘5 Whys’ technique with this tool to help construct the bones of the chart. The answer to each ‘why’ question results in a new branch off of the previous one that the question originated from.
Fishbone Advantages:
This tool builds on simple list creation. The fishbone diagram serves as a useful tool to capture individual opinions. The team can talk about the information in-hand and identify additional possible causes. In a lot of ways, it is similar to identifying the conditions for a Snapchart, but that is where the comparison ends.
Fishbone Disadvantages:
The fishbone diagram is an opinion-based tool. Its design limits the user’s ability to visually define multiple levels of ‘why’ answers, unless the visual medium in use is really large. Worse yet, users rely on opinion (a vote of some form) to select the most likely causes from the list. Teams then define and test possible countermeasures for the selected causes to see if the problem goes away. This can consume significant time and money. The tool also does not focus on generic cause identification and and elimination.
Four Key TapRooT® Root Cause Analysis Advantages
Here are four primary reasons why I feel the TapRooT® root cause analysis process is superior to any of the above listed tools:
- It is a closed loop process. First, you use Snapchart evidence for problem definition (define). Second, we use the root cause tree to identify root causes (measure and analyze). Finally, a multi-step corrective action process helps you define well-rounded problem solutions (improve).
- The snapchart is time-based. This tool shows the sequence of events that come before and after a given problem. This tool helps the user identify a more complete set of events and conditions that led to a given problem’s occurrence.
- The process is based on a set of well-developed operational definitions and questions. These questions and definitions come from years of research and application. The root cause selection process is evidence-drive and helps to discourage opinion-based root cause selection.
- The process encourages the identification of generic causes. If you correct generic causes, you will prevent similar problems in other parts of the organization or in other products or services in the product / service line.
Four More TapRooT® Root Cause Analysis Advantages
- The process software contains hundreds of possible corrective actions. Hundreds of companies use these best practices to correct and prevent the problems that result from both singular and generic causes.
- The process is grounded in human factors theory. Human factors theory supports the fact that people are the key to organizational success. Most often, the source of most problems is due to the design of the systems and processes they use and the decisions they make as they do their jobs each day.
- The software’s design and content encourages and enables the individual problem solver, or a team of problem solvers, to keep their efforts focused and organized. Key software tools include the dictionary, corrective action helper, Snapchart, and the root cause analysis process. Software design also helps maintain the linkages between the snapchart causal factors, the root causes selected, the identified corrective actions, and the assortment of incidents one analyzes.
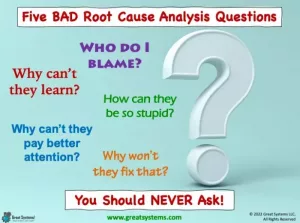
LEARN MORE: Five Bad Root Cause Analysis Questions … and Some Great Ones Too!
Value = What You Get for What It Costs
The results that you get from this tool’s use, versus the time you invest to use it, almost always far outweighs the results you get from the time you invest in any of the vintage root cause analysis tools. The time requirement per tool application is not much, if any, more. The quality of results is far superior. In most cases, a couple of hours of use with most of the above tools would only give you a list of possible causes. In the same amount of time, the TapRooT® process will give you a clear problem definition and storyline. More importantly, you end up with a focused root cause set and a sound corrective action mix.

Keep improving!
Kevin McManus, Chief Excellence Officer, Great Systems
WATCH over 50 kaizen and workplace health improvement videos on my Great Systems YouTube channel.
CHECK OUT my ‘Teach Your Teams’ workbooks on Amazon.com
LIKE Great Systems on Facebook
© Copyright 2024, Great Systems LLC, All Rights Reserved