
Be Proactive with Process Improvement
How to be Proactive with Work Process Improvement
In this post, I share how I learned to be proactive with process improvement daily. I regularly tell my peers and colleagues that I would not want to do any type of management job, no matter how well it paid, if I was not allowed to trend process performance daily.
Plus, I believe that you cannot consistently improve process performance, let alone sustain high levels of performance over time, without process-level analysis.
This post comes my 'How to be Proactive with Daily Work Process Improvement' eBook. Click the link below to download the entire eBook PDF.
DOWNLOAD my 'How to be Proactive with Daily Work Process Improvement' eBook
Proactive Work Process Improvement Starts with Daily Measurement
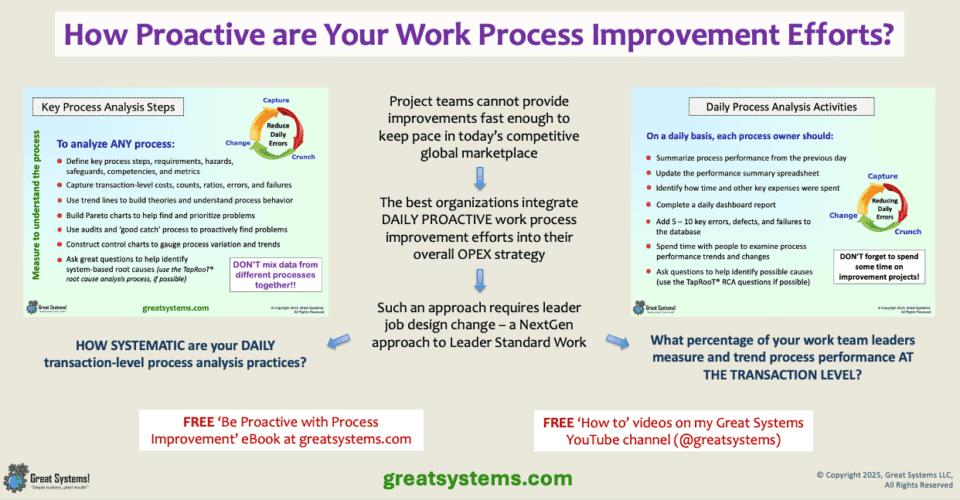
Do you want to perform effective process performance analysis and improvement opportunity identification? If so, the regular use of line charts, check sheets, control charts, error tracking datasets, and Pareto charts is a must.
Why? It’s simple. I hate to be blindsided by surprises. As a plant manager, I learned that it is stressful enough to consistently meet shifting customer expectations.
I don’t need unexpected process problems that distract the team, break our flow, disrupt the process, and cost precious time and money. Unfortunately, most organizations practice reactive versus proactive process improvement.
My experiences have shown me that a lot of organizations don’t use these tools on a regular basis. Usually, they only review snapshots of process performance on a weekly or monthly basis.
The percentage of companies that use trend lines and Pareto charts to look at performance on a daily, process-specific basis, in my opinion, does not even equal fifty percent.
To become a high-performance workplace or organization, each process owner needs to track around 5-10 key process counts each day. Plus, they need to do this for all key performance areas - safety, quality, cost, and people.
Process owners MUST know how they spend the time and money they are responsible for each day!
Practice Transaction-Level Lean Data Capture
Most importantly, daily measurement must happen at the transaction level! Once you have the counts, you can create trend lines with control limits for your ratios. This helps you better understand process variation.
You can, and should, use technology to help you capture and analyze this information. However, you cannot convince me that one can sustain continuous improvement if they only do these tasks once a week, or less.
If you follow the guidelines I propose, you quickly notice the impact of errors, defects, and failures that you may have been aware of, but accepted as being normal or a mere nuisance.
Additionally, ALWAYS include transaction time, delay, and defect costs in your daily process measure mix. If you do, you soon will be able to use process transaction costs as a key process effectiveness gauge.
Work to consistently reduce process transaction costs over time. This cost control strategy is a much more effective approach versus monthly budget line-item management.
Make Proactive Process Improvement a Daily Kaizen Work Habit
For process excellence from the inside out to work, it has to become a daily work habit. Plus, I think it is key that each process owner enter their own data each day.
Don’t just have someone else do it for them and give them a summary report. Also, you can have other people help you collect the data. In fact, this is recommended.
However, I have learned that there is value to gain when a process owner enters numbers into their own performance summary spreadsheet, completes their own daily dashboard, and updates their own error tracking database.
There is something about the re-entry of a common downtime problem five times in a database on one day that tends to make that problem more obvious than a summary line item on a report.
Each morning (at the start of my shift), I began the day by crunching the numbers. Often, the information I needed was on a variety of reports that my people had completed at the end of their shift the day before.
At other times, I had to go out and ask people for more details about what had happened for a given mistake or failure.
Effective leaders understand how the time and money they are responsible for each day is spent. Proactive process improvement tools help you capture this daily information for measurement and analysis purposes so you can spend that time and money more wisely in the future.

Spend Time with Your Process Work Teams
Recognize that you have to spend time with your people for this process to work. Your people are sources of information for improvement options and problem investigation.
Plus, you have a responsibility to give them daily positive and negative feedback about personal and process performance. You can’t recognize, coach, and learn from others when you sit behind a desk!
Finally, recognize that human error is not a root cause of a problem. Look for the weak, or missing, systems that should have helped prevent the problem from becoming larger. Focusing on finding someone to blame is not an effective strategy for preventing future errors.
Over time, leaders should help their team understand the different factors that affect human error rates. Teach them how to assess the daily risk associated with their work.
It is not a people problem – it is a process problem! Show your work teams how different error-producing conditions increase error likelihood when present. When such practices become leader standard work – daily work habits – proactive process improvement is in place.
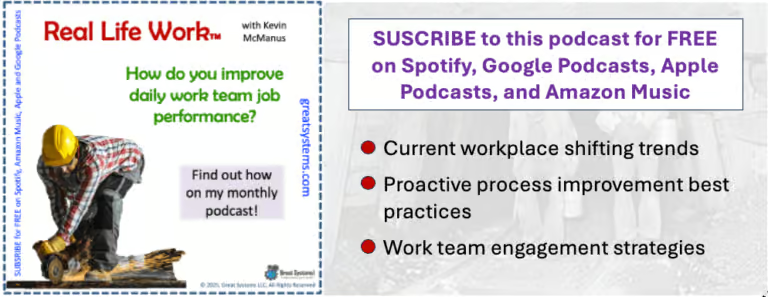
LISTEN NOW to my 'Be Proactive with Process Improvement" Real Life Work podcast
Use the Capture-Crunch-Change Process Daily
This diagram summarizes how to use the different tools I share in this eBook on a daily basis to help drive proactive process-level improvement.
These tools help you capture transaction-level costs, counts, ratios, errors, and failures DAILY at the process level.
The original data comes from a variety of sources. Possible sources include timekeeping records, database, and other transaction-specific records. Also, operators can complete check sheets to provide key error and failure information.
Look for ways to use new technology for lean data capture. For example, replace hand data entry with QR code scans.
Use triggers and notifications to prompt people when special process needs or hazards exist in the work for that day. Let geofences and RFID technology help you capture dates and times for key process steps and transaction processing.
Key Daily Tools to be Proactive with Process Improvement
The performance summary spreadsheet captures key counts and ratios for the team’s workday (one row per day). Plus, it converts process counts into ratios for trend analysis. Finally, the process owner uses the daily performance dashboard (one report per day) to share the results with others.
The daily performance dashboard captures key problems for that day, such as errors, defects, downtime, rework, scrap, and wait time. Then, the problems and their attributes enter the Error Tracker database (master list of problems) for future analysis. Typically, trend line and error breakdown Pareto analysis is done monthly. However, one can easily view aggregate data, or data splits, at any time.
I learned a lot simply entering the key counts and ratios, along with the key problems, each day. This daily data entry gave me a pretty good idea as to what changes were needed and how well my recent fixes were working.
Monthly summaries provide a snapshot of your current key problems and the types of improvement progress being made.
A key improvement project list provides a common location to hold for all ongoing, planned, and ‘on hold’ ideas that the team identifies. The first five columns provide space for the idea description, owner, status, completion date, and next steps.
Perhaps more importantly, a sixth column exists to capture the current completion percentage for each project. When you compare monthly reports over time, the ‘Percent Complete’ column helps identify slow moving projects that may require additional resources or support.

Capture Key Daily Transaction Counts and Ratios
Do you want to require each process owner to improve those processes that he or she is responsible for? If so, the use of a tool like the example shown helps.
Leaders use the performance summary spreadsheet daily to monitor the number of process transactions that they complete in each day. Plus, the tool captures the cost of those transactions and other key inputs and ratios that are part of their execution.
It may be the case that your processes don’t go through multiple cycles in a shift or day. If that is true, you still need to use this tool. However, you only need to update the spreadsheet as you complete a given cycle, instead of daily.
Because this spreadsheet captures data in table form, you can easily trend and analyze it further. For example, you can construct charts for both individual input and ratio trends. Plus, such data helps you examine correlations that may exist between different numbers (such as rework and throughput rates).
The goal of this tool’s use is to capture all key inputs associated with the execution of one or more process cycles. Once you collect the inputs, you can create a variety of time-based, and cost-based, ratios to help you better understand, evaluate, and improve your process.
Step Up to 21st Digital Lean Data Capture Solutions
Consider the use of no-code application software such as QuickBase to help you capture data at the process source. Plus, these cost affordable solutions minimize data entry errors, data entry costs, and data analysis delays. Set up correctly, their use can quickly become an effective work team engagement strategy.
One of the mistakes organizations make relates to the combination of data from different processes together into one big number. For example, this is what we do when we only look at performance to budget monthly as an attempt to control labor costs.
If we are under budget, we relax. When we are over budget, we try to come up reasons why we are in this position. We ask people to do a better job at cost control.
Unfortunately, we often look at the performance of several processes when we evaluate our costs in this manner. In turn, we mix good process performances with bad process performances. When we mix process data, it becomes more difficult to target those processes that need our attention the most.
Worse yet, we struggle to find and recognize those people whose processes did show improvement in the most recent month. How do you analyze process performance? Do you really know how excellent your processes are without great process data?
DOWNLOAD my 'How to be Proactive with Daily Work Process Improvement' eBook