Real Life Work Podcast with Kevin McManus
Welcome to the 'Real Life Work' Podcast with Kevin McManus
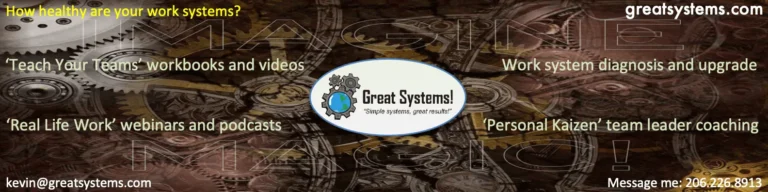
The "Real Life Work with Kevin McManus" podcast is a forum for sharing best practices that lead to better workplaces, communities, and souls.
On a regular basis, this podcast connects you with 'real life work' leaders who continue to sustain success in the world of work system performance design, diagnosis, and improvement.
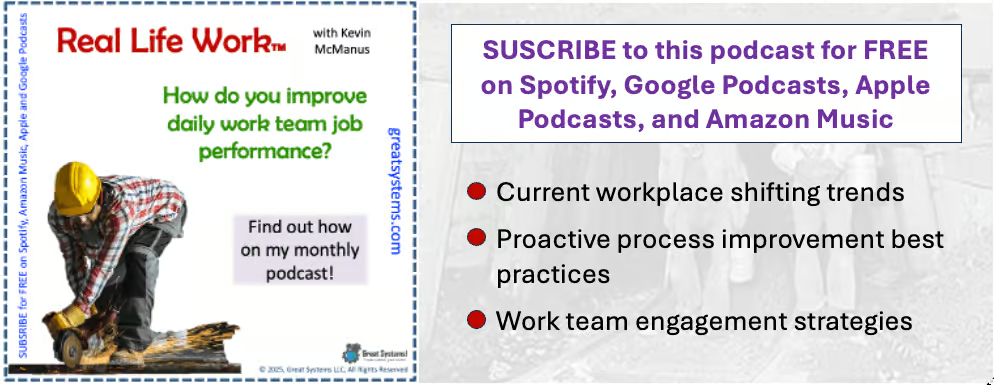
PLEASE SUBSCRIBE to my podcast on Spotify, Google Podcasts, Apple Podcasts, or Amazon Music.
On a regular basis, this podcast connects you with 'real life work' leaders who continue to sustain success in the world of work system performance design, diagnosis, and improvement.
PLEASE SUBSCRIBE to my podcast on Spotify, Google Podcasts, Apple Podcasts, or Amazon Music.
How Does my Real Life Work Podcast Work?
Currently, I try to record at least one podcast each month. All episodes are captured for on-demand listening. You can subscribe to this podcast on Spotify, Google Podcasts, Apple Podcasts, and Amazon Music.
If you want to be interviewed as part of a weekly show, you are welcome. Simply message Kevin and let him know your area of expertise. He will then contact you to explain the podcast format and give you an initial set of 'starter' questions.
Also, be sure to check out the Great Systems YouTube channel.
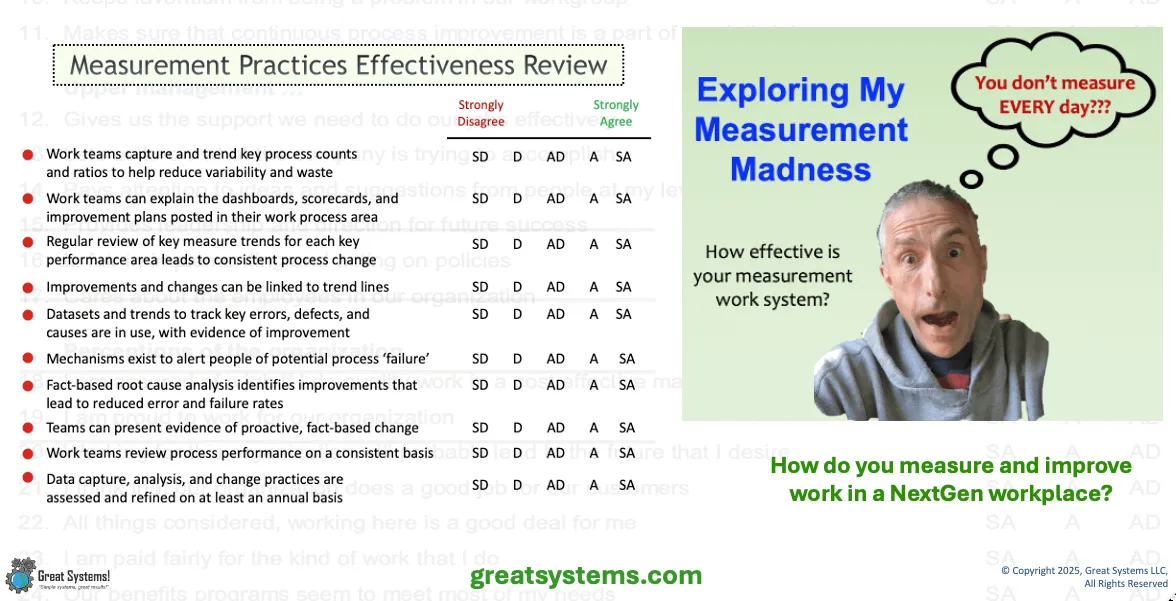
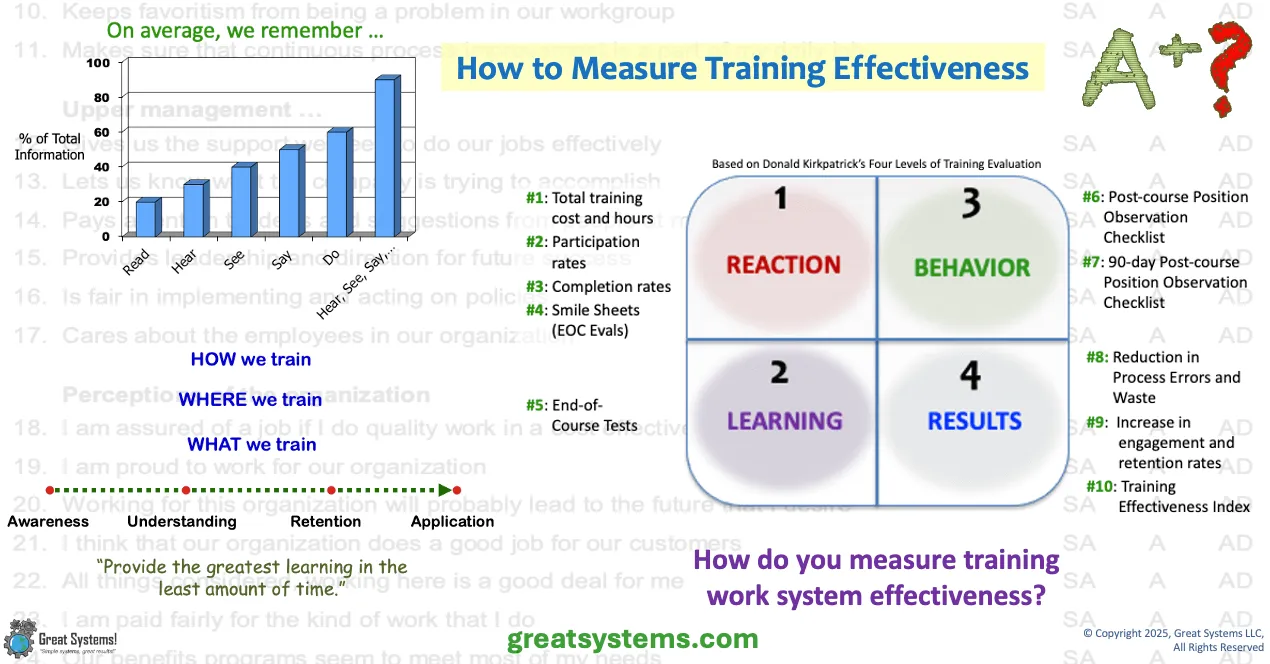
'Real Life Work' MEASUREMENT Best Practices Podcasts
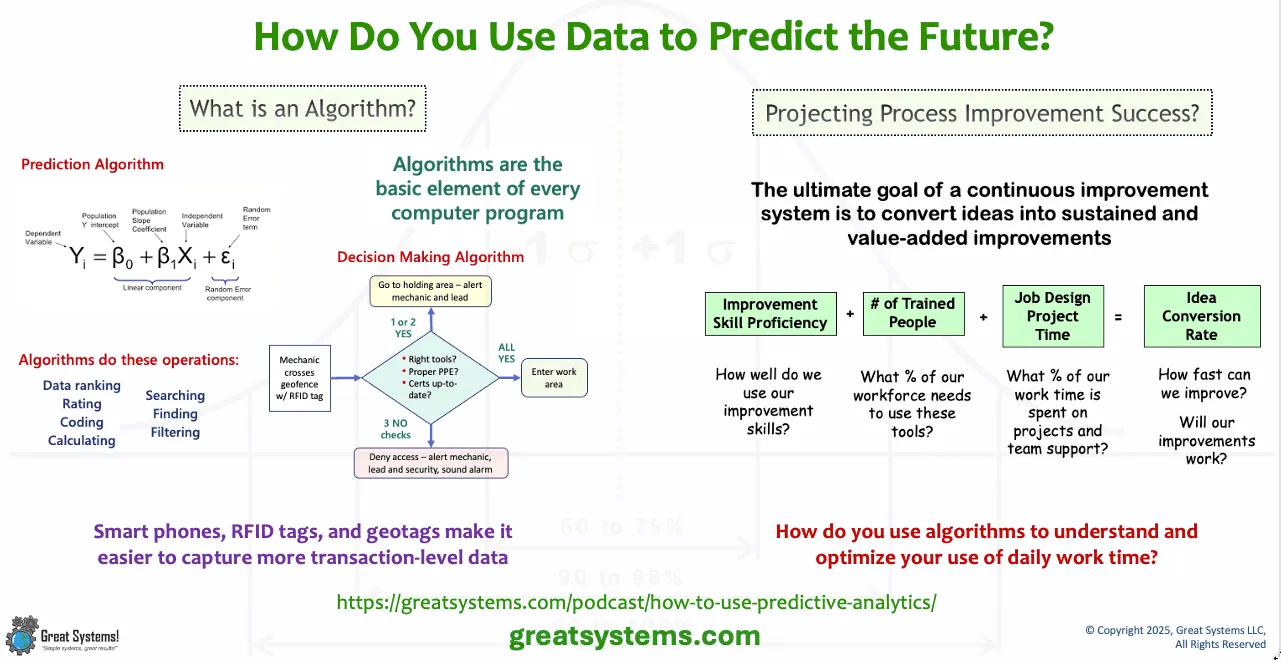
LISTEN to my ‘How to Use Predictive Analytics at Work’ podcast
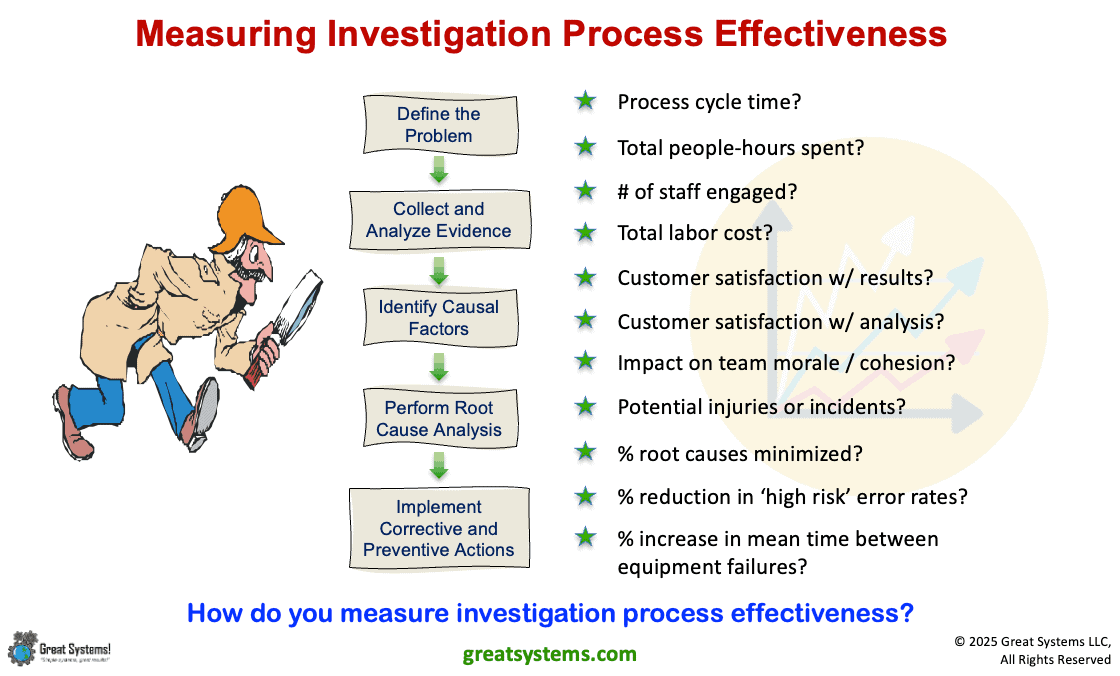
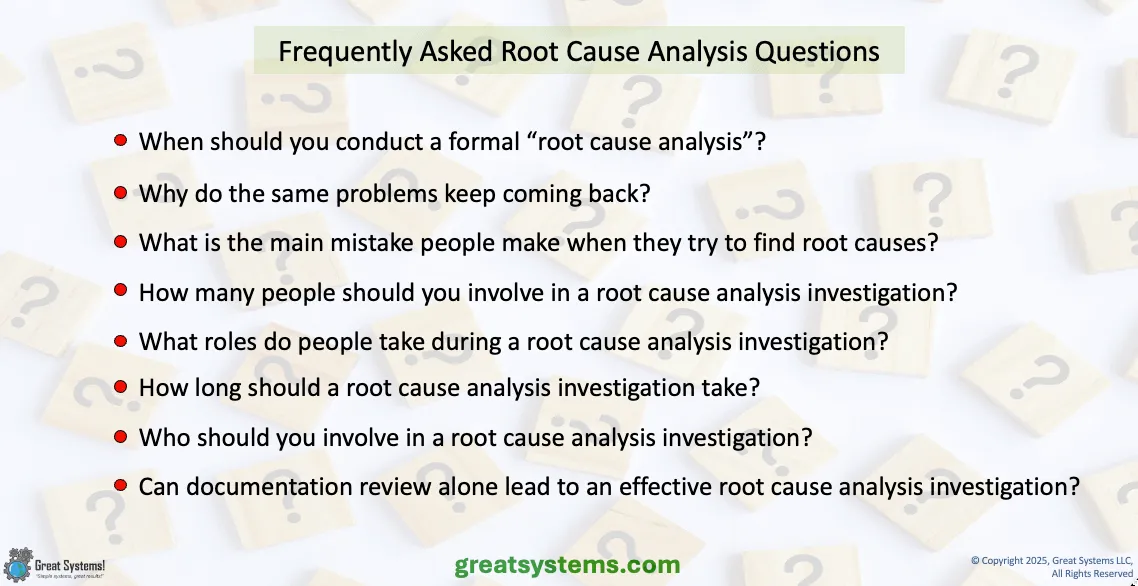
LISTEN to my ‘How to Measure Investigation Process Effectiveness’ podcast
'Real Life Work' WORK TEAMS Best Practices Podcasts
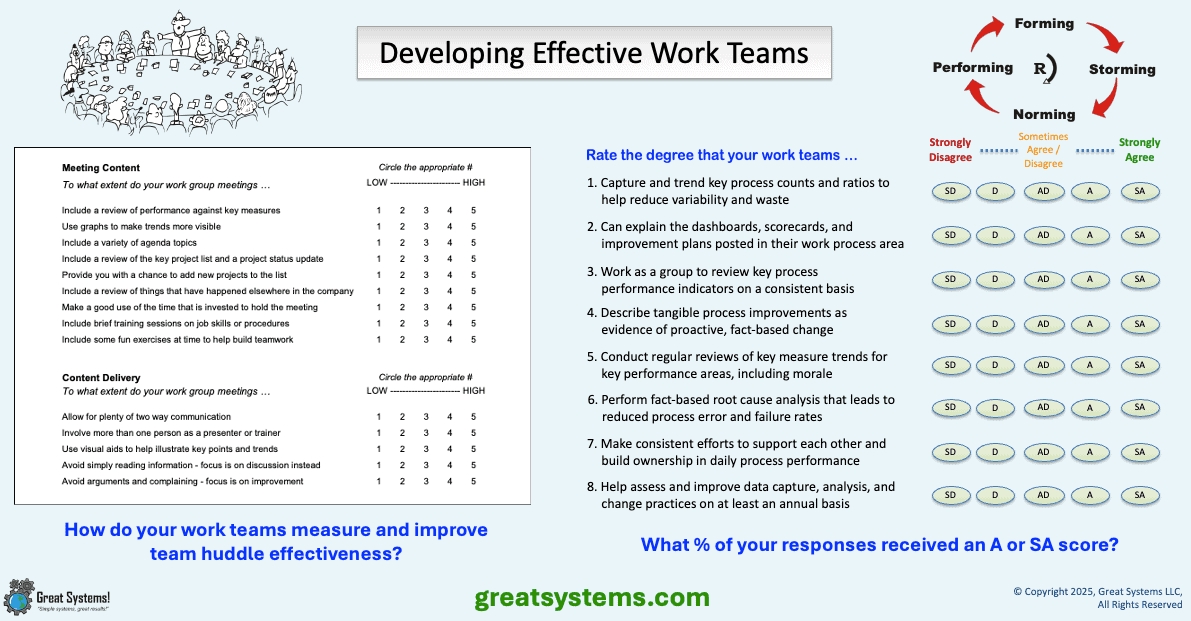
LISTEN to my ‘Too Many Work Teams, Too Little Team Success’ podcast
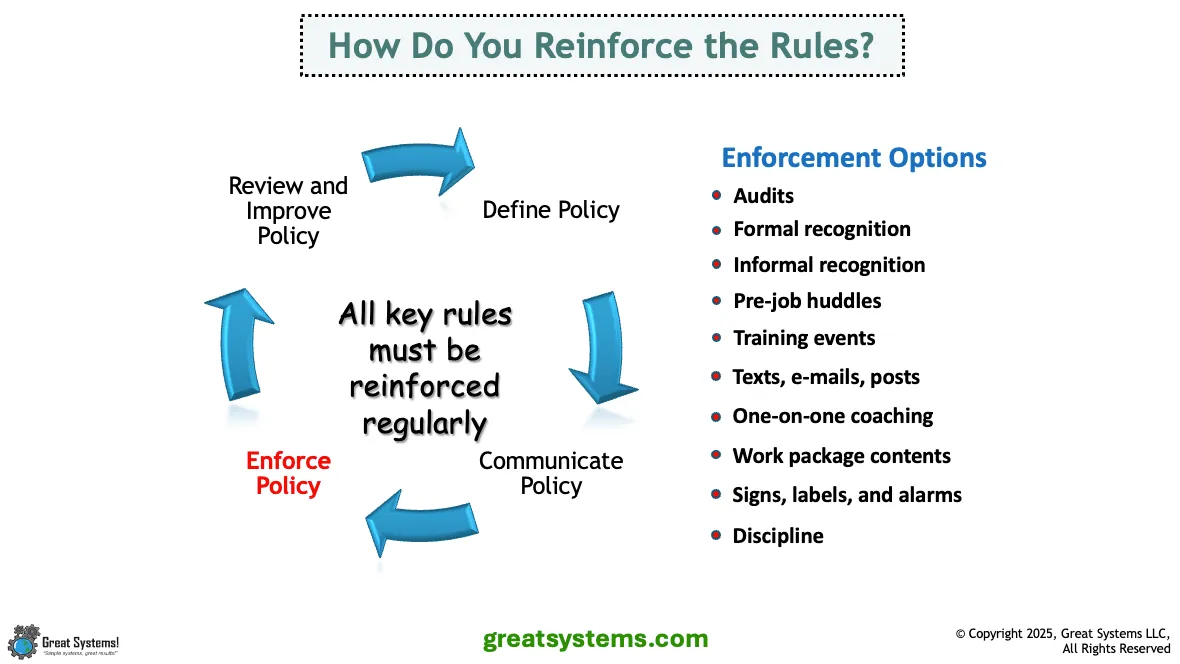
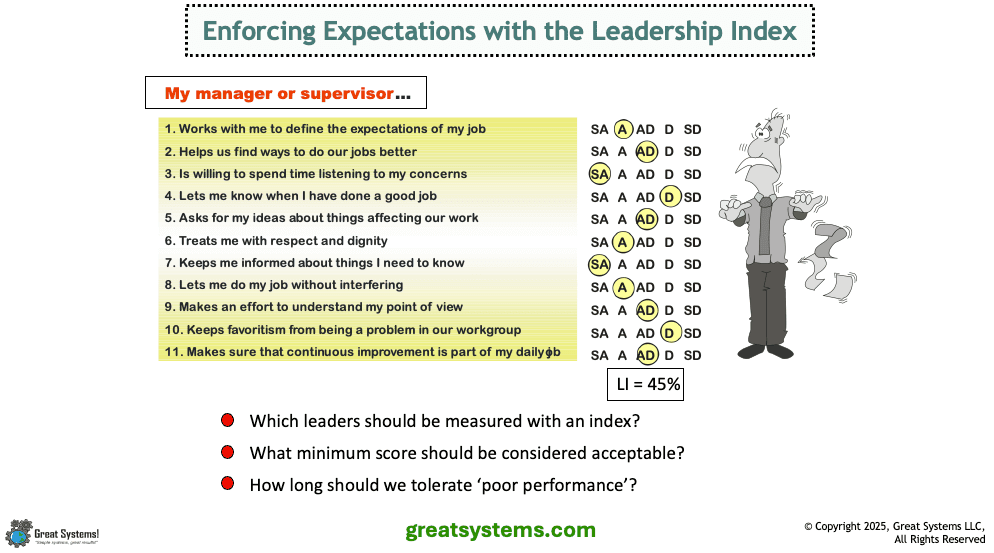
LISTEN to my ‘Four Steps to Effective Rule Enforcement’ podcast
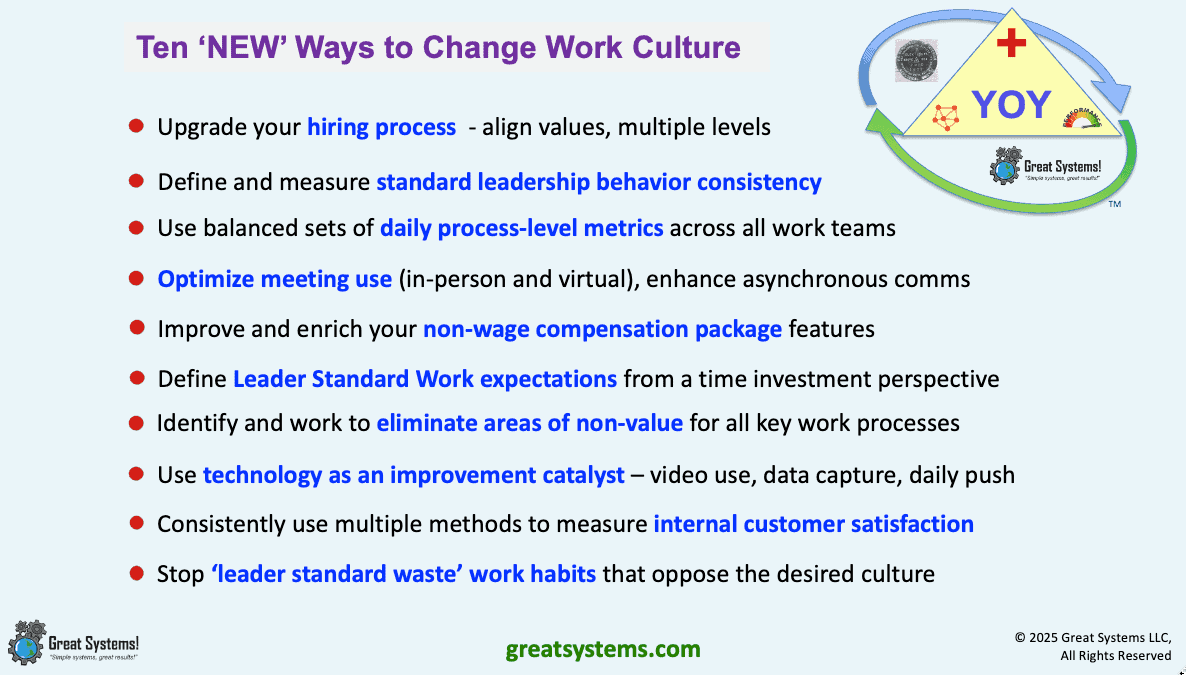
LISTEN to my ‘Ten Ways to Change Work Culture’ podcast
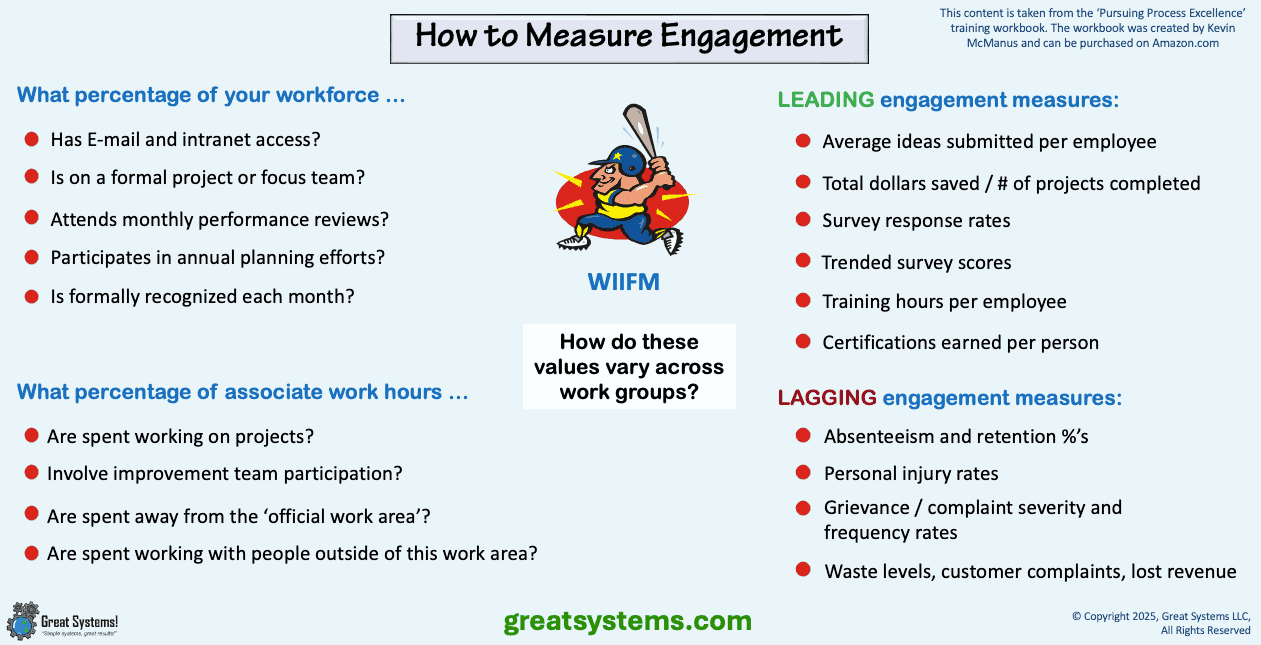
LISTEN to my ‘How to Measure and Improve Employee Ownership’ podcast
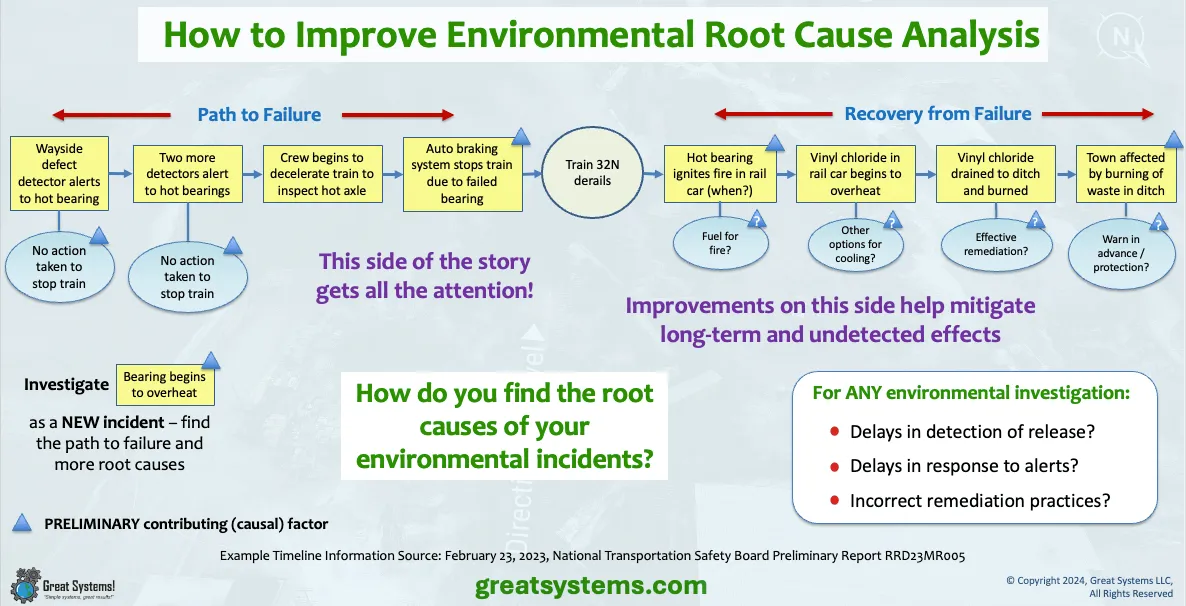
'Real Life Work' KAIZEN and ROOT CAUSE ANALYSIS Best Practices Podcasts
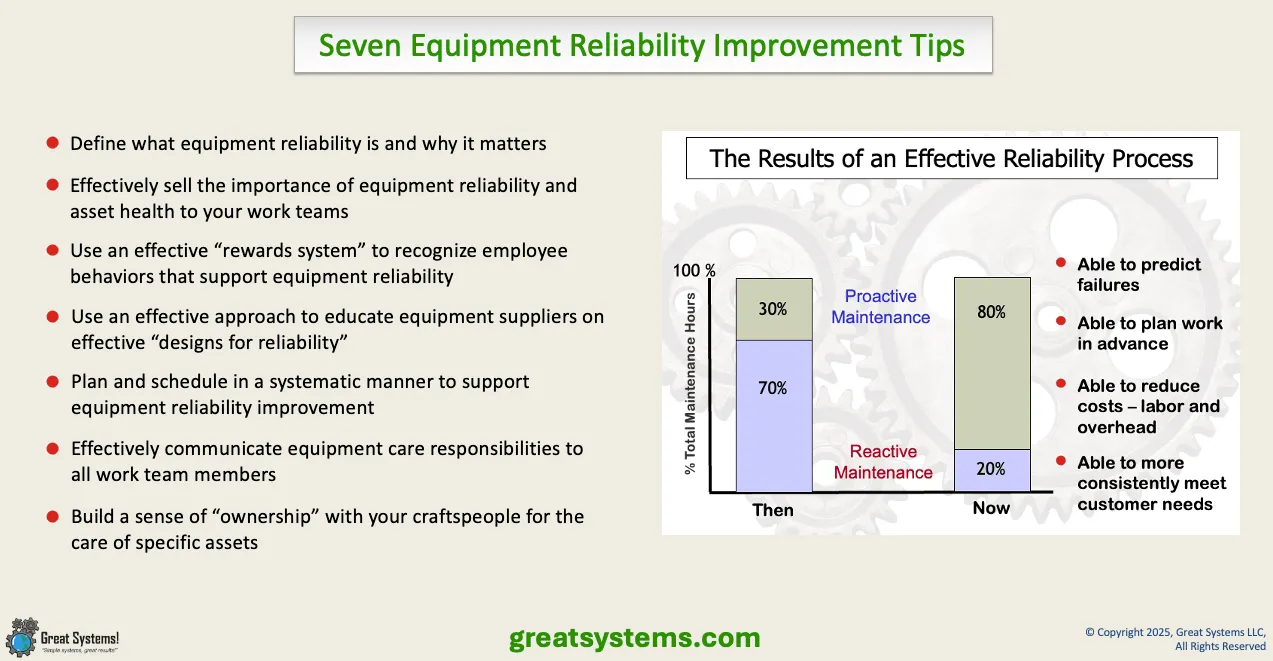
LISTEN to my ‘Seven Equipment Reliability Improvement Tips’ podcast
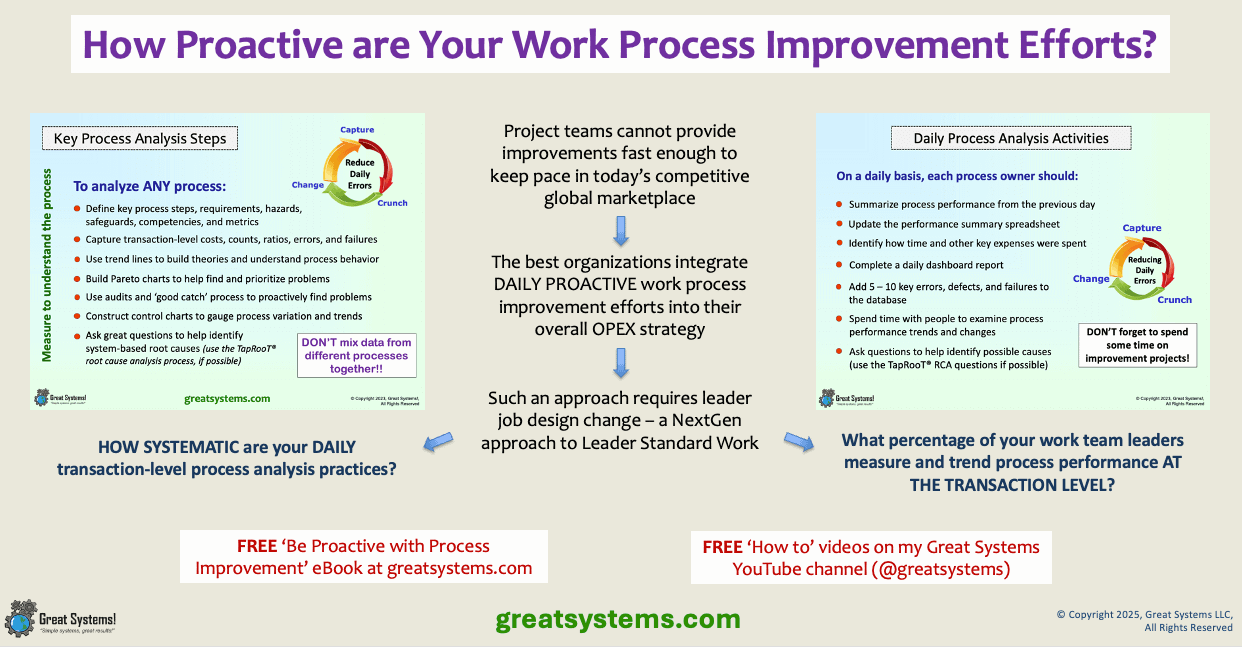
LISTEN to my ‘Be Proactive with Process Improvement’ podcast
Who hosts the 'Real Life Work' podcast?
The podcast is hosted by Kevin McManus ... ME! I have been the sole proprietor and Chief Excellence Officer of Great Systems LLC for over 20 years.
Each day, I invest 1-2 hours research time, looking at what the best workplaces do to sustain kaizen and operational excellence. On the Great Systems website, I regularly share my best practice findings and learnings.
I base my 'Real Life Work' perspective on three things. First, my daily leadership and kaizen focus comes from 25 years of front-line manager experience.
Second, 20 years of volunteer Malcolm Baldrige National Quality Award Examiner service connected me with great workplaces. Finally, I have taught over 10,000 people around the world the TapRooT® root cause analysis process as a 20-year contract instructor.
My personal mission is to help people move closer to achieving their personal, team, and organizational potential each day.
Feel free to explore the site, and please send me your questions. Keep improving!